
A leaderboard has more than one winner
Switch skills and see why the ordering changes.
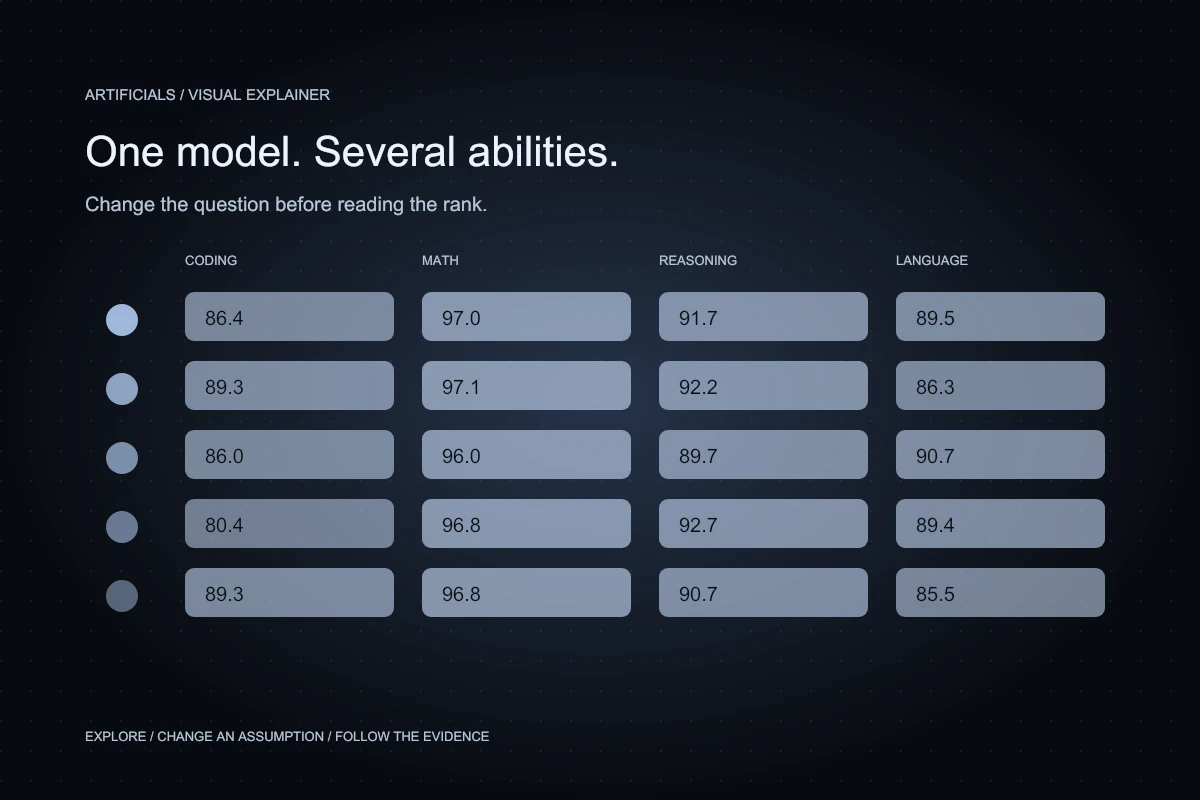
A leaderboard compresses a complicated evaluation into an order that is easy to scan. That compression is useful until the order starts answering questions the test never asked. A model that leads one kind of problem can trail on another. A configuration that is strong in a controlled benchmark can behave differently inside an application with tools, documents, and strict output requirements.
This article turns that issue into something you can inspect. The interactive comparison keeps a fixed group of evaluated configurations while changing the skill being displayed. The bars move because the metric changes, not because the page invents a universal intelligence score. A second view places the same values side by side so an impressive overall impression does not erase an uneven profile.
The data comes from the LiveBench snapshot already used by Artificials. The sample consists of the first eight configurations in the bundled overall ranking. It is a teaching selection, not a complete leaderboard and not a claim that these eight are the only candidates worth considering. Exact configuration identifiers remain visible for checking.
Change the question, then read the order
Change the skill. Watch the order.
Eight configurations selected by overall rank, matched by exact ID across skills. Values are reported scores, not estimates.
Sorted by Coding · score / 100 · higher is better
- Anthropic · claude-opus-5-5-max-effort
 Claude Opus 5.5 Max Effort89.25
 - Anthropic · claude-opus-5-5-xhigh-effortClaude Opus 5.5 Xhigh Effort89.25
- Anthropic · claude-fable-5-1-max-effortClaude Fable 5.1 Max Effort86.38
- Anthropic · claude-fable-5-max-effortClaude Fable 5 Max Effort85.99
- OpenAI · gpt-5.6-sol-max
 GPT-5.6 Sol Max83.94
 - See source · muse-spark-1.3-xhigh
 Muse Spark 1.3 Xhigh81.06
 - OpenAI · gpt-6-astra-maxGPT-6 Astra Max80.36
- DeepSeek · deepseek-v4.1-flash-max
 DeepSeek V4.1 Flash Max80.04
No uncertainty bounds are reported for these rows in the bundled data. A narrow lead is not a claim of statistical significance. Open the full coding ranking.
Choose coding, mathematics, reasoning, or language in the first figure. Each choice sorts the same configurations by that category's reported value. The scale remains zero to one hundred, so changing categories does not quietly magnify a small difference by tightening the axis. The numeric score sits next to the bar and remains available without interpreting color.
Look for a configuration whose position changes. That movement is not necessarily an inconsistency in the evaluation. It can be the expected result of measuring different abilities. The useful follow-up is to ask which of those abilities resembles your work and which important requirement is absent from the available categories.
Preserve the identity of what was evaluated
A model family name is not always a complete description of an evaluated system. Different effort settings, checkpoints, prompting arrangements, and tool access can affect the result. Combining the best score from one configuration with the best score from another can create a profile that no single deployable configuration actually achieved.
The figures match rows using the exact configuration identifier in each category. They do not merge names because they look similar. If a selected configuration lacks a value, the visual displays a missing result instead of a zero. Zero is a measurement; missing is a statement about available evidence. Treating them as equivalent changes the story.
This identity rule also helps when you inspect a result elsewhere on the site. Follow the category's full leaderboard and look for the recorded setting. If an API or downloaded checkpoint exposes a different version, treat that as a new candidate to evaluate. A familiar brand name is not proof that the tested system and your deployed system are identical.
Understand what the benchmark is trying to measure
LiveBench describes a collection of tasks spanning several capabilities and a process intended to make evaluation more resistant to contamination through refreshed questions and objective checking. Its research explains why the construction of questions and scoring procedures matters, not just the eventual model order. Those design goals do not make any benchmark a complete simulation of every product.
Read the original research paper on arXiv
For an application team, the next step is to map a test category to a real requirement. Coding might be relevant to generating a function, but your workflow may also need repository navigation, environment setup, and checking an ambiguous issue. Language performance may help with a support assistant, yet access control and faithfulness to an internal policy require separate evidence.
The diagram does not resolve those gaps by adding more decimal places. It supplies a useful observation about a defined test. Your job is to preserve the scope of that observation while deciding how much weight it deserves in a practical choice.
Read a profile across columns
One configuration, several abilities
Eight configurations selected by overall rank, matched by exact ID across skills. Values are reported scores, not estimates.
Sorted by Coding · score / 100 · higher is better
| Configuration | Coding | Mathematics | Reasoning | Language |
|---|---|---|---|---|
| Claude Opus 5.5 Max EffortAnthropic | 89.25 | 97.08 | 92.15 | 86.27 |
| Claude Opus 5.5 Xhigh EffortAnthropic | 89.25 | 96.80 | 90.65 | 85.50 |
| Claude Fable 5.1 Max EffortAnthropic | 86.38 | 97.01 | 91.69 | 89.50 |
| Claude Fable 5 Max EffortAnthropic | 85.99 | 95.99 | 89.65 | 90.68 |
| GPT-5.6 Sol MaxOpenAI | 83.94 | 96.20 | 91.65 | 87.68 |
| Muse Spark 1.3 XhighSee source | 81.06 | 95.95 | 89.65 | 82.79 |
| GPT-6 Astra MaxOpenAI | 80.36 | 96.81 | 92.65 | 89.43 |
| DeepSeek V4.1 Flash MaxDeepSeek | 80.04 | 93.29 | 86.69 | 81.19 |
No uncertainty bounds are reported for these rows in the bundled data. A narrow lead is not a claim of statistical significance. Open the full coding ranking.
The score matrix lets you inspect every selected skill at once. Read across one configuration before comparing it with another. This reveals whether its performance is broadly strong within the sample or concentrated in particular categories. Then read down a single column, where the task and scoring scale are held fixed.
Do not average the visible columns simply because they share a zero-to-one-hundred display range. Their questions, difficulty distributions, and aggregation procedures can differ. An arbitrary mean could overvalue a task that your product rarely performs and undervalue the one failure that matters most. A shared numeric range is not a shared business meaning.
If you need a combined application score, define it from your own task distribution and make the weighting explicit. For example, a fictional document assistant might spend most of its workload extracting facts and a smaller share drafting prose. That workload description can guide evaluation design, but it should not be presented as an official benchmark formula.
Separate a visible lead from a meaningful lead
A difference in displayed scores does not, by itself, establish how stable the ordering is. Consider the number of evaluated tasks, variability across runs, and whether the results are paired on the same questions. Confidence intervals or standard errors, when supplied by a source, add information about uncertainty. The absence of such fields is not evidence that uncertainty disappeared.
The chosen LiveBench rows do not supply uncertainty bounds in this site's dataset. The article therefore does not draw invented error bars or label a narrow lead statistically significant. It shows the reported values and leaves the inferential claim open. This is less dramatic than declaring a decisive winner, but it is more faithful to the available evidence.
In a local evaluation, preserve per-example outcomes rather than only a mean. Two systems can have similar totals while failing on different cases. Those disagreements are valuable material for review because they reveal what a switch would improve and what it might break.
Examine the denominator behind a percentage
A score becomes easier to reason about when you understand what contributes to it. Is each question equally weighted? Does a task award partial credit? Are multiple subtests averaged? Are refusals, timeouts, and malformed answers counted consistently? The same displayed number can arise from different scoring contracts.
As an invented illustration, one assistant might complete eighteen of twenty straightforward tasks and fail both tasks involving exceptions. Another might complete seventeen tasks, including both exceptions. The first has a higher simple success fraction, while the second may be preferable if handling exceptions is essential. This is not a reported result for any model in the figure.
The lesson is to connect the denominator to the decision. Do not silently remove failed or timed-out attempts because they make a comparison messy. If exclusions are necessary, report the rule and how many cases it removed. A tidy chart should be the result of clear measurement, not selective disappearance.
Translate the comparison into a small application test
Use the category view to choose a manageable set of candidates. Then assemble reviewed examples from the intended workload. Include ordinary cases, difficult cases, cases with missing information, and cases that should trigger a refusal or handoff. Write the expected behavior before looking at model outputs.
Run the candidates under comparable constraints. A model given a tool, extra attempts, or a larger reasoning budget may be solving a different operational problem from one that receives a single short prompt. Sometimes that difference is exactly what you want to study, but name it as a system comparison rather than attributing everything to the base model.
Record useful completion, review effort, latency, and resource use together. The public leaderboard helps you decide what to investigate. The application test decides whether the candidate fits the job. Keeping those stages separate prevents a broad benchmark from carrying more responsibility than its methodology supports.
Use disagreement as a research clue
When two evaluation sources disagree, first inspect their task definitions and configurations. A preference ranking, a repository-level agent benchmark, and a narrowly checked mathematics test need not order models the same way. Their disagreement can reveal a genuine distinction in what they reward rather than an error that must be smoothed away.
Keep each scale intact. Do not subtract an Arena rating from a percentage score, and do not place unrelated numbers on one axis without an explicit transformation and a reason. A visually unified dashboard can accidentally imply mathematical comparability that the underlying data does not have.
For a reader, the practical habit is simple: ask what changed between the two measurements. That question usually produces more useful insight than choosing whichever ranking confirms a preferred model. It also encourages better reporting, because task, configuration, and scoring method become part of the headline's meaning.
Make a shortlist you can explain
Return to the moving bars and identify the category most connected to your work. Inspect the exact configuration, read the source, and compare the other columns. Then name the requirements that the figure cannot establish. This produces a shortlist with an evidence trail rather than a favorite with a persuasive animation.
The best outcome of reading a leaderboard is not memorizing its first row. It is knowing what that row does and does not support. Once the question is explicit, several apparent winners can coexist, and the choice among them becomes a testable engineering decision.